Tools & Editors in Flutter: Integrated Development Environments(IDEs)

Android Studio, IntelliJ & Visual Studio:
Creating a new project:
In Android Studio:
In the IDE, click New Flutter Project from the Welcome window or File > New > New Flutter Project from the main IDE window.
Specify the Flutter SDK path and click Next.
Enter your desired Project name, Description, and Project location.
If you might publish this app, set the company domain.
ClickFinish.
In IntelliJ:
In the IDE, click New Project from the Welcome window or File > New > Project from the main IDE window.
Select Flutter from the Generators list in the left panel
Specify the Flutter SDK path and click Next.
Enter your desired Project name, Description, and Project location.
If you might publish this app, set the company domain.
Click Finish.
In Visual Studio:
Go to View > Command Palette....
You can also press Ctrl / Cmd + Shift + P.
Type
flutter.Select the Flutter: New Project.
Press Enter.
Select Application.
Press Enter.
Select a Project location.
Enter your desired Project name.
Opening a project from existing source code:
In Android Studio & In IntelliJ:
Click Open from the Welcome window, or File > Open from the main IDE window.
Browse to the directory holding your existing Flutter source code files.
In Visual Studio:
Go to File > Open.
You can also press Ctrl / Cmd + O
Browse to the directory holding your existing Flutter source code files.
Click Open.
Running and Debugging:
In Android studio & IntelliJ:
You can debug your app in a few ways.
Using DevTools, a suite of debugging and profiling tools that run in a browser and include the Flutter inspector.
Using Android Studio's (or IntelliJ's) built-in debugging features, such as the ability to set breakpoints.
Using the Flutter inspector, directly available in Android Studio and IntelliJ.
Running and debugging are controlled from the main toolbar:
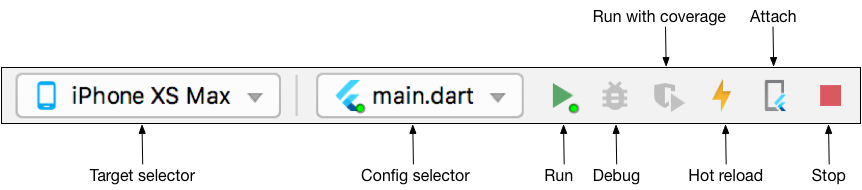
If the Run and Debug buttons are disabled, and no targets are listed, Flutter has not been able to discover any connected iOS or Android devices or simulators. You need to connect a device, or start a simulator, to proceed.
In Visual Studio:
You can debug your app in a couple of ways.
Using DevTools, a suite of debugging and profiling tools that run in a browser.
Using VS Code's built-in debugging features, such as setting breakpoints.
Start debugging by clicking Run > Start Debugging from the main IDE window, or press F5.
When a Flutter project is open in VS Code, you should see a set of Flutter specific entries in the status bar, including a Flutter SDK version and a device name (or the message No Devices):

The Flutter extension automatically selects the last device connected. However, if you have multiple devices/simulators connected, click device in the status bar to see a pick-list at the top of the screen.
Select the device you want to use for running or debugging.
Run app with breakpoints:
In Android studio & IntelliJ:
If desired, set breakpoints in your source code.
Click the Debug icon in the toolbar, or invoke Run > Debug.
The bottom Debugger pane shows Stack Frames and Variables.
The bottom Console pane shows detailed logs output.
Debugging is based on a default launch configuration. To customize this, click the drop-down button to the right of the device selector, and select Edit configuration.
In Visual Studio:
If desired, set breakpoints in your source code.
Click Run > Start Debugging. You can also press F5. The status bar turns orange to show you are in a debug session.
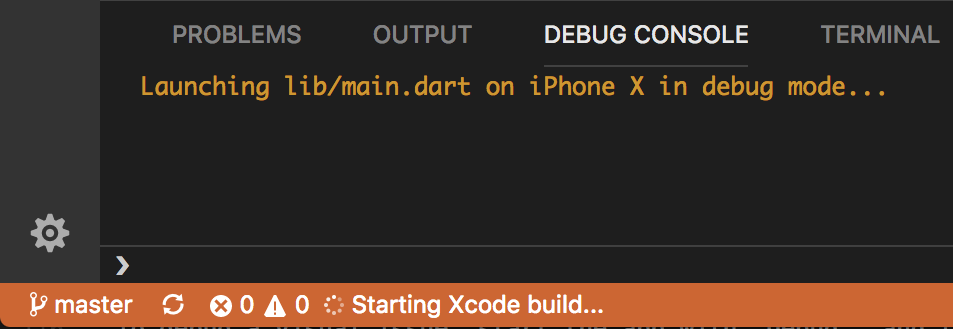
The left Debug Sidebar shows stack frames and variables.
The bottom Debug Console pane shows detailed logging output.
Debugging is based on a default launch configuration. To customize, click the cog at the top of the Debug Sidebar to create a
launch.jsonfile. You can then modify the values.Run app in debug, profile, or release mode in VS code
Flutter offers many different build modes to run your app in. You can read more about them in Flutter's build modes.
Open the
launch.jsonfile in VS Code.If you don't have a
launch.jsonfile:Go to View > Run.
You can also press Ctrl / Cmd + Shift + D
The Run and Debug panel displays.
Click create a launch.json file.
In the
configurationssection, change theflutterModeproperty to the build mode you want to target.For example, if you want to run in debug mode, your
launch.jsonmight look like this:json
 "configurations": [
   {
     "name": "Flutter",
     "request": "launch",
     "type": "dart",
     "flutterMode": "debug"
   }
 ]
content_copy
Run the app through the Run panel.


