Introduction
DevTools is a suite of performance and debugging tools for Dart and Flutter.
By leveraging DevTools, developers can identify and resolve issues efficiently, optimize app performance, and build high-quality Flutter applications.
Launch DevTools In VS Code
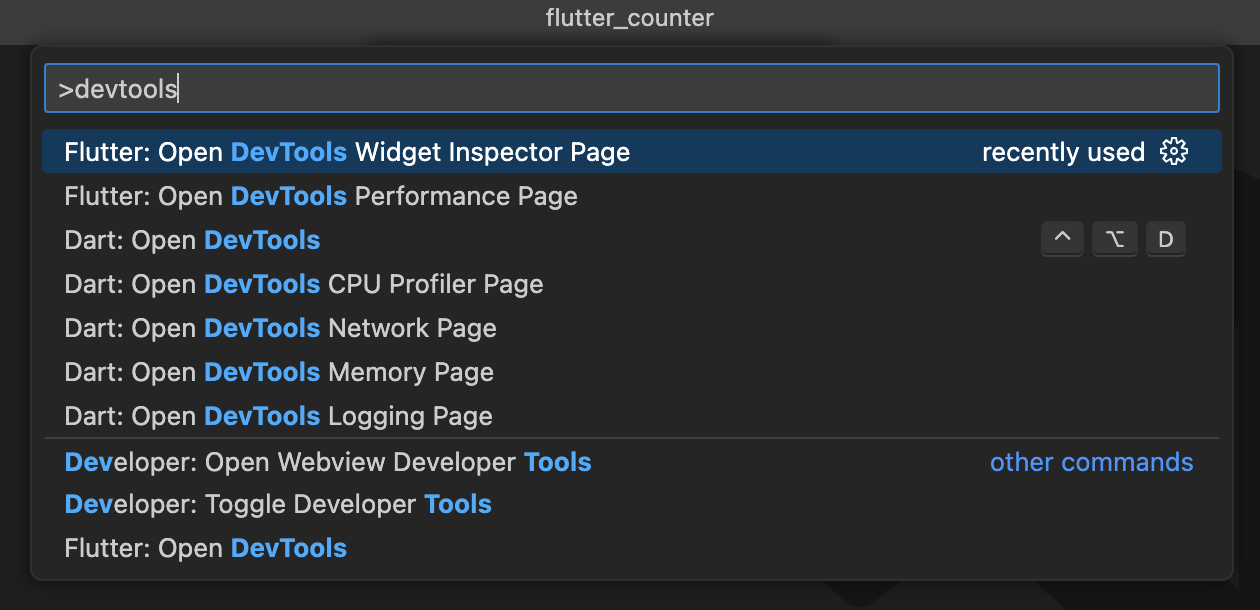
Once the debug session is active and the application has started, the Open DevTools commands become available in the VS Code command palette (F1):

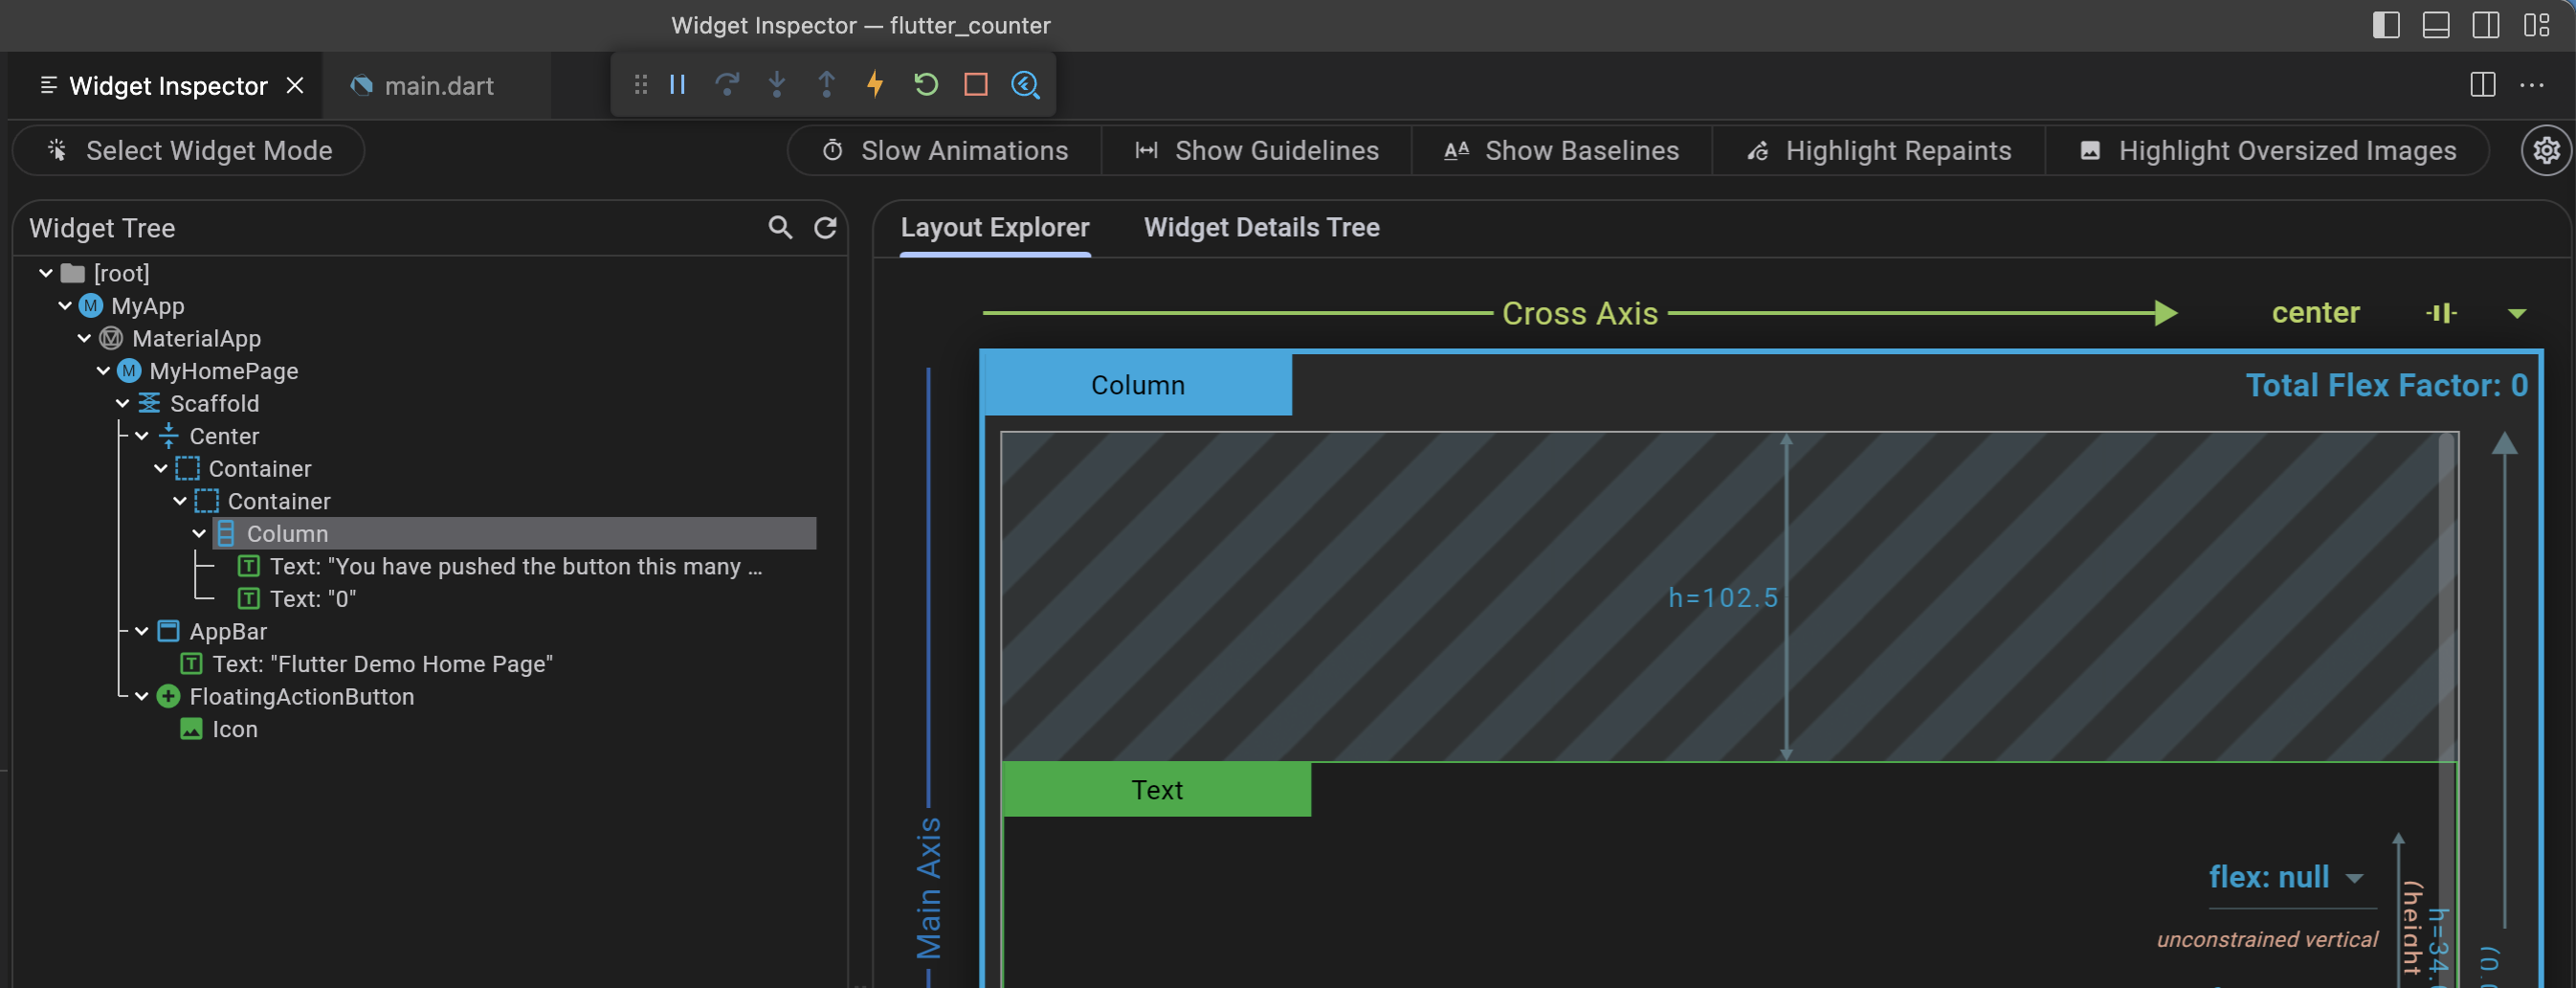
The chosen tool will be opened embedded inside VS Code.

You can choose to have DevTools always opened in a browser with the dart.embedDevTools setting, and control whether it opens as a full window or in a new column next to your current editor with the dart.devToolsLocation setting.
You can also see whether DevTools is running and launch it in a browser from the language status area (the {} icon next to Dart in the status bar).

In Android Studio:
Install the Flutter plugin
Install the Flutter plugin if you don't already have it installed. This can be done using the normal Plugins page in the IntelliJ and Android Studio settings. Once that page is open, you can search the marketplace for the Flutter plugin.
Start an app to debug
To open DevTools, you first need to run a Flutter app. This can be accomplished by opening a Flutter project, ensuring that you have a device connected, and clicking the Run or Debug toolbar buttons.
Launch DevTools from the Toolbar/Menu
Once an app is running, you can start DevTools using one of the following:
Select the Open DevTools toolbar action in the Run view.
Select the Open DevTools toolbar action in the Debug view. (if debugging)
Select the Open DevTools action from the More Actions menu in the Flutter Inspector view.

What are DevTools extensions?
DevTools extensions are developer tools provided by third-party packages that are tightly integrated into the DevTools tooling suite.
Extensions are distributed as part of a pub package, and they are dynamically loaded into DevTools when a user is debugging their app.
